Manning WA 6152
2,242 addresses · 37 streets
Swan Electorate › South Perth LGA › Manning · 7 km from Perth
📦 Thinking of moving here? Read the Manning moving guide

Living Here
Manning is a suburb of Western Australia, home to about 4,219 people, with a median age of 38. The typical household earns around $2,208 a week, with median rent near $340 a week. Most homes are houses. About 67% of households own their home and 31% rent. Most workers drive to work. Common community backgrounds include English, Australian, Irish. On the ABS socio-economic scale it sits in decile 9 of 10 nationally — a relatively advantaged area.
Over time — Census 2001 → 2021
Dashed line: district figures for the Manning - Waterford statistical area (SA2), the smallest area the ABS published before 2011. Solid line: Manning itself.
Getting Around & Local Services
1 beach
3 pharmacies
3 bakeries
2 hairdressers
3 beauty salons
1 electrician
Getting around. Train station: Canning Bridge, 1.4 km west · Metro station: Perth Underground, 6.9 km north · Railway halt: Canning Junction, 4.5 km east · Bus interchange: Curtin Central, 2.3 km north-east · Ferry wharf: Mends Street Jetty, 5 km north · Airport: Jandakot Airport, 8.9 km south.
Socio-economic Standing
Deciles from 1 (lowest) to 10 (highest), against all Australian suburbs. The overall figure weighs advantage and disadvantage together; economic resources counts income and housing, and education & jobs counts qualifications and occupation. They often differ. Source: ABS SEIFA 2021.
Tree cover
🌳 Tree canopy: 9.3% share of land under canopy · satellite map, 2020
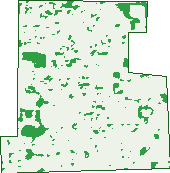
Green: 10 m cells where trees dominate, satellite 2021. Blue: water. The line is the suburb boundary.
| Canopy share, 1 m canopy height map, 2020 | 9.3% |
|---|---|
| Land with trees, 10 m satellite map, 2021 | 6.8% |
Demographics
Unemployment 4.5% · Labour-force participation 66.1%
Population by age in Manning
| 0-4 | 241 |
|---|---|
| 5-14 | 572 |
| 15-19 | 271 |
| 20-24 | 305 |
| 25-34 | 487 |
| 35-44 | 602 |
| 45-54 | 582 |
| 55-64 | 475 |
| 65-74 | 425 |
| 75-84 | 182 |
| 85+ | 81 |
Dwelling types in Manning
| House | 1,368 |
|---|---|
| Townhouse | 159 |
| Apartment | 25 |
| Other | 0 |
Households by weekly income in Manning
| <$650 | 229 |
|---|---|
| $650-1,499 | 300 |
| $1,500-2,999 | 366 |
| $3,000+ | 550 |
Top ancestries in Manning
| English | 1,549 |
|---|---|
| Australian | 1,356 |
| Other | 619 |
| Irish | 416 |
| Chinese | 410 |
| Scottish | 386 |
Housing tenure in Manning
| Owned | 466 |
|---|---|
| Mortgage | 567 |
| Rented | 479 |
| Other | 27 |
Cars per household in Manning
| 0 | 87 |
|---|---|
| 1 | 510 |
| 2 | 669 |
| 3 | 212 |
| 4+ | 72 |
Commute to work in Manning
| Car | 1,393 |
|---|---|
| Train | 32 |
| Bus | 72 |
| Tram/ferry | 0 |
| Walked | 13 |
| Bicycle | 27 |
| Home | 221 |
Top countries of birth in Manning
| England | 239 |
|---|---|
| China | 81 |
| New Zealand | 80 |
| Malaysia | 78 |
| Indonesia | 67 |
| India | 56 |
Languages used at home in Manning
| Mandarin | 157 |
|---|---|
| Cantonese | 57 |
| Indonesian | 55 |
| Arabic | 40 |
| Persian | 34 |
| French | 25 |
Birds & Wildlife Nearby
118,535 bird observations recorded near Manning — most often seen:
- Laughing Turtle-dove (6,631)
- South-western Australian Magpie (5,588)
- Western Red Wattlebird (5,366)
- South-western Singing Honeyeater (5,263)
- Pacific Black Duck (5,163)
- Eastern Rainbow Lorikeet (5,082)
- Australian White Ibis (5,020)
- Western Australian Raven (4,876)
- Willie Wagtail (4,260)
- Southern Willie Wagtail (4,250)
- Australian Raven (4,236)
- Rainbow Lorikeet (4,167)
- Southern Magpie-lark (4,095)
Show all 30 birds recorded near Manning
- Red Wattlebird (3,958)
- Western Brown Honeyeater (3,737)
- Eastern Asian Spotted Dove (3,635)
- Little Pied Cormorant (3,579)
- Eurasian Coot (3,423)
- Singing Honeyeater (3,415)
- Twenty-eight Parrot (3,365)
- Black Swan (3,308)
- Little Black Cormorant (3,241)
- Dusky Moorhen (3,210)
- South-western New Holland Honeyeater (2,956)
- Australasian Grebe (2,948)
- Western Galah (2,909)
- Australasian Darter (2,835)
- Australian Pelican (2,770)
- New Holland Honeyeater (2,628)
- Australian Magpie (2,621)
Sightings reported by observers, not a survey, so the counts show what people record rather than what lives here. Source: Atlas of Living Australia.
Nearby Suburbs
The closest suburbs to Manning:
- Salter Point (1 km)
- Karawara (1.5 km)
- Como (1.7 km)
- Waterford (1.8 km)
- Mount Pleasant (2.4 km)
- Shelley (2.5 km)
- Applecross (2.8 km)
- Rossmoyne (2.9 km)
Embed this suburb
Add this free Manning stat card to your own site — just copy the code:
Preview:
Cite this page
Quoting these figures? Copy the credit line:
Keep an eye on Manning
One email when this data meaningfully changes — new census figures, prices, rankings. No spam, unsubscribe anytime.
Streets
- Abjornson Street (11)
- Bickley Crescent (100)
- Bradshaw Crescent (133)
- Bruce Street (6)
- Bruning Road (33)
- Burnett Road (29)
- Canavan Crescent (98)
- Challenger Avenue (58)
- Cloister Avenue (149)
- Conochie Crescent (136)
- Cornish Crescent (39)
- Craigie Crescent (34)
- Crawshaw Crescent (96)
- Davilak Crescent (23)
- Downey Drive (115)
- Duckett Drive (14)
- Elderfield Road (16)
- Forward Street (45)
- Godwin Avenue (71)
- Goss Avenue (24)
- Griffin Crescent (132)
- Henley Street (13)
- Henning Crescent (146)
- Hope Avenue (90)
- Isabella Crescent (42)
- Jarman Avenue (10)
- Kelsall Crescent (73)
- Ley Street (2)
- Manning Road (105)
- Marsh Avenue (68)
- Mount Henry Road (2)
- Parsons Avenue (133)
- Pether Road (65)
- Talbot Avenue (15)
- Trumper Road (5)
- Warner Court (25)
- Welwyn Avenue (86)