Jolimont WA 6014
1,331 addresses · 23 streets
Curtin Electorate › Subiaco LGA › Jolimont · 5 km from Perth
📦 Thinking of moving here? Read the Jolimont moving guide

Living Here
Jolimont is a suburb of Western Australia, home to about 1,479 people, with a median age of 52. The typical household earns around $1,345 a week, with median rent near $300 a week. Most homes are apartments. About 48% of households own their home and 34% rent. Most workers drive to work. Common community backgrounds include English, Australian, Irish. On the ABS socio-economic scale it sits in decile 9 of 10 nationally — a relatively advantaged area.
Over time — Census 2001 → 2021
Dashed line: district figures for the Subiaco - Shenton Park statistical area (SA2), the smallest area the ABS published before 2011. Solid line: Jolimont itself.
Getting Around & Local Services
39 hospitals
- King Edward Memorial Hospital
- Concept Fertility Centre
- St John of God Subiaco Eye Hospital
- Saint John of God Hospital Subiaco
- Subiaco Private Hospital
- Perth Day Surgery Centre
- City Lower West Older Adult Mental Health Service (Selby OAMH)
- West Leederville Private Hospital
- Queen Elizabeth II Medical Centre
- Sir Charles Gairdner Hospital
4 childcare & kindergartens
2 butchers
2 plumbers
Getting around. Train station: Daglish, 650 m south · Metro station: Perth Underground, 4.5 km east · Bus interchange: Elizabeth Quay Bus Station, 4.2 km east · Ferry wharf: Elizabeth Quay Ferry Terminal, 4.4 km east · Airport: Perth Airport, 14.3 km east.
Socio-economic Standing
Deciles from 1 (lowest) to 10 (highest), against all Australian suburbs. The overall figure weighs advantage and disadvantage together; economic resources counts income and housing, and education & jobs counts qualifications and occupation. They often differ. Source: ABS SEIFA 2021.
Tree cover
🌳 Tree canopy: 15.3% share of land under canopy · satellite map, 2020
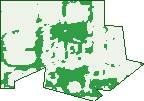
Green: 10 m cells where trees dominate, satellite 2021. Blue: water. The line is the suburb boundary.
| Canopy share, 1 m canopy height map, 2020 | 15.3% |
|---|---|
| Land with trees, 10 m satellite map, 2021 | 27.9% |
Demographics
Unemployment 5.7% · Labour-force participation 52.2%
Population by age in Jolimont
| 0-4 | 43 |
|---|---|
| 5-14 | 95 |
| 15-19 | 48 |
| 20-24 | 88 |
| 25-34 | 204 |
| 35-44 | 154 |
| 45-54 | 152 |
| 55-64 | 114 |
| 65-74 | 203 |
| 75-84 | 230 |
| 85+ | 149 |
Dwelling types in Jolimont
| House | 205 |
|---|---|
| Townhouse | 138 |
| Apartment | 404 |
| Other | 0 |
Households by weekly income in Jolimont
| <$650 | 184 |
|---|---|
| $650-1,499 | 212 |
| $1,500-2,999 | 171 |
| $3,000+ | 142 |
Top ancestries in Jolimont
| English | 640 |
|---|---|
| Australian | 476 |
| Irish | 185 |
| Other | 180 |
| Scottish | 178 |
| Chinese | 82 |
Housing tenure in Jolimont
| Owned | 217 |
|---|---|
| Mortgage | 136 |
| Rented | 251 |
| Other | 138 |
Cars per household in Jolimont
| 0 | 78 |
|---|---|
| 1 | 413 |
| 2 | 194 |
| 3 | 36 |
| 4+ | 14 |
Commute to work in Jolimont
| Car | 377 |
|---|---|
| Train | 37 |
| Bus | 27 |
| Tram/ferry | 0 |
| Walked | 29 |
| Bicycle | 17 |
| Home | 71 |
Top countries of birth in Jolimont
| England | 101 |
|---|---|
| China | 28 |
| India | 27 |
| South Africa | 27 |
| Iran | 19 |
| Scotland | 19 |
Languages used at home in Jolimont
| Mandarin | 43 |
|---|---|
| Persian | 17 |
| French | 15 |
| Japanese | 15 |
| Spanish | 10 |
| Cantonese | 8 |
Birds & Wildlife Nearby
271,166 bird observations recorded near Jolimont — most often seen:
- Pacific Black Duck (14,352)
- Willie Wagtail (13,760)
- Red Wattlebird (12,914)
- Australian Raven (12,699)
- Rainbow Lorikeet (12,193)
- Eurasian Coot (12,000)
- Australian White Ibis (11,588)
- Dusky Moorhen (11,269)
- Black Swan (10,719)
- Singing Honeyeater (9,805)
- Australasian Grebe (9,717)
- Australian Magpie (9,693)
- Grey Teal (9,386)
Show all 30 birds recorded near Jolimont
- Magpie-lark (9,232)
- Australasian Purple Swamphen (8,830)
- Australian Shelduck (8,822)
- Australian Wood Duck (8,553)
- Little Pied Cormorant (8,324)
- Brown Honeyeater (8,125)
- Little Black Cormorant (6,995)
- Welcome Swallow (6,834)
- Little Corella (6,783)
- Laughing Turtle-dove (6,730)
- Great Egret (6,525)
- South-western Australian Magpie (6,436)
- Silvereye (5,952)
- Australasian Darter (5,900)
- Australian Pelican (5,890)
- Galah (5,707)
- Great Crested Grebe (5,433)
Sightings reported by observers, not a survey, so the counts show what people record rather than what lives here. Source: Atlas of Living Australia.
Nearby Suburbs
The closest suburbs to Jolimont:
- Daglish (0.5 km)
- Subiaco (1.3 km)
- Wembley (1.3 km)
- Shenton Park (1.5 km)
- Floreat (1.8 km)
- West Leederville (2.3 km)
- Karrakatta (2.4 km)
- Herdsman (2.7 km)
Embed this suburb
Add this free Jolimont stat card to your own site — just copy the code:
Preview:
Cite this page
Quoting these figures? Copy the credit line:
Keep an eye on Jolimont
One email when this data meaningfully changes — new census figures, prices, rankings. No spam, unsubscribe anytime.
Streets
- Allison Drive (2)
- Anther Lane (6)
- Bishop Street (33)
- Cardigan Terrace (27)
- Currie Street (137)
- Dakin Street (19)
- Halesworth Road (27)
- Hay Street (194)
- Hortus Way (125)
- Jersey Street (196)
- Jolimont Terrace (3)
- Lansdowne Street (34)
- Maddock Lane (2)
- Peel Street (51)
- Pollen Grove (103)
- Roberta Street (32)
- Rosebery Street (36)
- Salvado Road (4)
- Selby Street (3)
- Tighe Street (227)
- Troy Terrace (63)
- Upham Street (2)
- Wilsmore Street (5)