Mutdapilly QLD 4307
187 addresses · 22 streets
Wright Electorate › Scenic Rim LGA › Mutdapilly · 48 km from Brisbane

Living Here
Mutdapilly is a suburb of Queensland, home to about 308 people, with a median age of 44. The typical household earns around $1,593 a week, with median rent near $300 a week. Most homes are houses. About 86% of households own their home and 14% rent. Most workers drive to work. Common community backgrounds include Australian, English, German. On the ABS socio-economic scale it sits in decile 5 of 10 nationally — a mid-range area.
Over time — Census 2001 → 2021
Dashed line: district figures for the Boonah statistical area (SA2), the smallest area the ABS published before 2011. Solid line: Mutdapilly itself.
Getting Around & Local Services
1 school
1 Catholic church
Socio-economic Standing
Deciles from 1 (lowest) to 10 (highest), against all Australian suburbs. The overall figure weighs advantage and disadvantage together; economic resources counts income and housing, and education & jobs counts qualifications and occupation. They often differ. Source: ABS SEIFA 2021.
Tree cover
🌳 Tree canopy: 8.7% share of land under canopy · satellite map, 2020
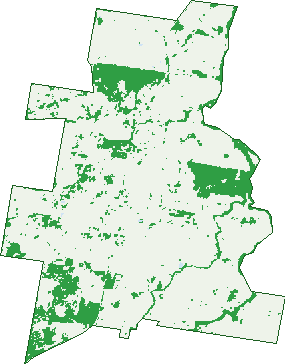
Green: 10 m cells where trees dominate, satellite 2021. Blue: water. The line is the suburb boundary.
| Canopy share, 1 m canopy height map, 2020 | 8.7% |
|---|---|
| Land with trees, 10 m satellite map, 2021 | 17.4% |
Demographics
Unemployment 3.9% · Labour-force participation 60.3%
Population by age in Mutdapilly
| 0-4 | 11 |
|---|---|
| 5-14 | 45 |
| 15-19 | 23 |
| 20-24 | 5 |
| 25-34 | 32 |
| 35-44 | 43 |
| 45-54 | 36 |
| 55-64 | 43 |
| 65-74 | 34 |
| 75-84 | 19 |
| 85+ | 0 |
Dwelling types in Mutdapilly
| House | 104 |
|---|---|
| Townhouse | 0 |
| Apartment | 0 |
| Other | 0 |
Households by weekly income in Mutdapilly
| <$650 | 14 |
|---|---|
| $650-1,499 | 25 |
| $1,500-2,999 | 28 |
| $3,000+ | 16 |
Top ancestries in Mutdapilly
| Australian | 149 |
|---|---|
| English | 125 |
| German | 34 |
| Scottish | 33 |
| Irish | 28 |
| Ancestry NS | 27 |
Housing tenure in Mutdapilly
| Owned | 47 |
|---|---|
| Mortgage | 36 |
| Rented | 14 |
| Other | 0 |
Cars per household in Mutdapilly
| 0 | 0 |
|---|---|
| 1 | 15 |
| 2 | 39 |
| 3 | 21 |
| 4+ | 24 |
Commute to work in Mutdapilly
| Car | 89 |
|---|---|
| Train | 0 |
| Bus | 0 |
| Tram/ferry | 0 |
| Walked | 5 |
| Bicycle | 0 |
| Home | 36 |
Top countries of birth in Mutdapilly
| England | 7 |
|---|---|
| New Zealand | 3 |
| Scotland | 3 |
Birds & Wildlife Nearby
887 bird observations recorded near Mutdapilly — most often seen:
- Torresian Crow (69)
- Australian Magpie (62)
- Willie Wagtail (50)
- Galah (47)
- Pale-headed Rosella (40)
- Welcome Swallow (37)
- Pied Butcherbird (35)
- Striated Pardalote (34)
- Straw-necked Ibis (33)
- Brown Honeyeater (32)
- Magpie-lark (32)
- Superb Fairy-wren (32)
- Nankeen Kestrel (31)
Show all 30 birds recorded near Mutdapilly
- Common Myna (30)
- Crested Pigeon (30)
- Black-faced Cuckoo-shrike (28)
- Pacific Black Duck (25)
- Australian Wood Duck (21)
- Noisy Miner (21)
- Scaly-breasted Lorikeet (21)
- Rainbow Lorikeet (20)
- Silvereye (19)
- Grey Fantail (18)
- Red-backed Fairy-wren (18)
- White-faced Heron (18)
- Blue-faced Honeyeater (17)
- Laughing Kookaburra (17)
- Masked Lapwing (17)
- Yellow-rumped Thornbill (17)
- Australasian Grebe (16)
Sightings reported by observers, not a survey, so the counts show what people record rather than what lives here. Source: Atlas of Living Australia.
Nearby Suburbs
The closest suburbs to Mutdapilly:
- Mount Forbes (5.3 km)
- Harrisville (6.5 km)
- Peak Crossing (7.9 km)
- Coleyville (8.3 km)
- Purga (8.8 km)
- Ebenezer (9.1 km)
- Warrill View (9.3 km)
- Wilsons Plains (9.7 km)
Embed this suburb
Add this free Mutdapilly stat card to your own site — just copy the code:
Preview:
Cite this page
Quoting these figures? Copy the credit line:
Keep an eye on Mutdapilly
One email when this data meaningfully changes — new census figures, prices, rankings. No spam, unsubscribe anytime.
Streets
- Caswells Lane (1)
- Coleyville Road (15)
- Cunningham Highway (28)
- Denman Road (2)
- G Hines Road (11)
- Gimpels Road (11)
- Goebels Road (14)
- Koskies Road (11)
- Kruger Road (6)
- Mutdapilly Churchbank Weir Road (25)
- Mutdapilly Dip Road (13)
- Nolan Lane (1)
- Peak Crossing Churchbank Weir Road (3)
- Poores Road (2)
- Seppanen Road (2)
- Shelbach Road (13)
- Spur Lane (2)
- Stephens Road (7)
- Sugarloaf Road (10)
- Theakers Road (7)
- Webers Road (1)
- Wendts Road (2)