Dee Why NSW 2099
15,291 addresses · 94 streets
Mackellar Electorate › Northern Beaches LGA › Dee Why · 15 km from Sydney
📦 Thinking of moving here? Read the Dee Why moving guide

Living Here
A northern-beaches hub of Sydney with a popular surf beach, Dee Why mixes apartments with coastal homes. Households average 2.3 people and the median age is 36. Median household income is $2,106 a week, with rent around $550.
Dee Why is a suburb of New South Wales, home to about 23,354 people, with a median age of 36. The typical household earns around $2,106 a week, with median rent near $550 a week. Most homes are apartments. About 51% of households own their home and 48% rent. Most workers drive to work. Common community backgrounds include English, Australian, Irish. On the ABS socio-economic scale it sits in decile 9 of 10 nationally — a relatively advantaged area.
Over time — Census 2001 → 2021
Dashed line: district figures for the Dee Why - North Curl Curl statistical area (SA2), the smallest area the ABS published before 2011. Solid line: Dee Why itself.
Getting Around & Local Services
11 doctors & medical clinics
1 physiotherapist
26 hospitals
4 beauty salons
2 electricians
Getting around. Train station: Roseville, 10.8 km west · Ferry wharf: Manly Wharf, 5.3 km south · Airport: Rose Bay Seaplane Base, 13.2 km south.
Socio-economic Standing
Deciles from 1 (lowest) to 10 (highest), against all Australian suburbs. The overall figure weighs advantage and disadvantage together; economic resources counts income and housing, and education & jobs counts qualifications and occupation. They often differ. Source: ABS SEIFA 2021.
Tree cover
🌳 Tree canopy: 14.3% share of land under canopy · satellite map, 2020
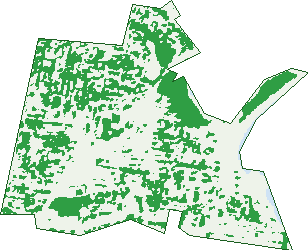
Green: 10 m cells where trees dominate, satellite 2021. Blue: water. The line is the suburb boundary.
| Canopy share, 1 m canopy height map, 2020 | 14.3% |
|---|---|
| Surveyed canopy, Greater Sydney aerial survey, 2019 | 21.4% |
| Land with trees, 10 m satellite map, 2021 | 32.6% |
Demographics
Unemployment 3.7% · Labour-force participation 72.1%
Population by age in Dee Why
| 0-4 | 1,481 |
|---|---|
| 5-14 | 2,024 |
| 15-19 | 864 |
| 20-24 | 1,464 |
| 25-34 | 4,932 |
| 35-44 | 4,196 |
| 45-54 | 3,037 |
| 55-64 | 2,544 |
| 65-74 | 1,589 |
| 75-84 | 862 |
| 85+ | 355 |
Dwelling types in Dee Why
| House | 1,512 |
|---|---|
| Townhouse | 240 |
| Apartment | 8,073 |
| Other | 26 |
Households by weekly income in Dee Why
| <$650 | 1,109 |
|---|---|
| $650-1,499 | 2,021 |
| $1,500-2,999 | 3,528 |
| $3,000+ | 2,736 |
Top ancestries in Dee Why
| English | 7,028 |
|---|---|
| Other | 5,606 |
| Australian | 5,233 |
| Irish | 2,134 |
| Scottish | 1,805 |
| Italian | 1,604 |
Housing tenure in Dee Why
| Owned | 2,064 |
|---|---|
| Mortgage | 2,886 |
| Rented | 4,670 |
| Other | 126 |
Cars per household in Dee Why
| 0 | 1,101 |
|---|---|
| 1 | 5,054 |
| 2 | 2,726 |
| 3 | 557 |
| 4+ | 270 |
Commute to work in Dee Why
| Car | 5,333 |
|---|---|
| Train | 14 |
| Bus | 1,083 |
| Tram/ferry | 3 |
| Walked | 551 |
| Bicycle | 88 |
| Home | 4,453 |
Top countries of birth in Dee Why
| England | 1,372 |
|---|---|
| Brazil | 985 |
| China | 849 |
| Nepal | 752 |
| India | 738 |
| New Zealand | 602 |
Languages used at home in Dee Why
| Portuguese | 1,069 |
|---|---|
| Nepali | 735 |
| Mandarin | 484 |
| Spanish | 460 |
| Serbian | 369 |
| Italian | 354 |
Birds & Wildlife Nearby
103,479 bird observations recorded near Dee Why — most often seen:
- Rainbow Lorikeet (6,678)
- Noisy Miner (5,382)
- Australian Magpie (5,226)
- Silver Gull (5,109)
- Common Myna (4,142)
- Welcome Swallow (4,082)
- White-faced Heron (3,999)
- Little Pied Cormorant (3,932)
- Crested Tern (3,722)
- Australian Raven (3,685)
- Little Black Cormorant (3,551)
- Australian Pelican (3,406)
- Sulphur-crested Cockatoo (3,392)
Show all 30 birds recorded near Dee Why
- Laughing Kookaburra (3,344)
- Little Wattlebird (3,266)
- Australian Brush-turkey (3,200)
- Masked Lapwing (3,137)
- Great Cormorant (3,110)
- Superb Fairy-wren (3,096)
- Red Wattlebird (3,021)
- Willie Wagtail (2,844)
- Red-necked Stint (2,623)
- Pacific Black Duck (2,618)
- Pied Cormorant (2,605)
- Pied Currawong (2,563)
- Magpie-lark (2,544)
- Ruddy Turnstone (2,399)
- Rock Dove (2,341)
- Sooty Oystercatcher (2,280)
- Grey Butcherbird (2,182)
Sightings reported by observers, not a survey, so the counts show what people record rather than what lives here. Source: Atlas of Living Australia.
Nearby Suburbs
The closest suburbs to Dee Why:
- North Curl Curl (1 km)
- Narraweena (1.5 km)
- Curl Curl (2 km)
- Brookvale (2.1 km)
- Cromer (2.1 km)
- Collaroy (2.4 km)
- Collaroy Plateau (2.6 km)
- Freshwater (2.7 km)
Embed this suburb
Add this free Dee Why stat card to your own site — just copy the code:
Preview:
Cite this page
Quoting these figures? Copy the credit line:
Keep an eye on Dee Why
One email when this data meaningfully changes — new census figures, prices, rankings. No spam, unsubscribe anytime.
Streets
- Arthur Street (62)
- Avon Road (123)
- Banksia Street (134)
- Bennett Street (31)
- Billarong Avenue (13)
- Bix Road (76)
- Boronia Street (226)
- Bridge Road (1)
- Bundilla Place (4)
- Burne Avenue (66)
- Bushey Place (18)
- Campbell Avenue (23)
- Carew Street (25)
- Cassia Lane (1)
- Cassia Street (193)
- Clarence Avenue (96)
- Clyde Road (84)
- Cumberland Avenue (1)
- Daisy Street (28)
- Dee Why Parade (796)
- Dela Close (5)
- Delmar Parade (529)
- Edna Place (19)
- Fisher Road (482)
- Francis Street (258)
- Grafton Crescent (176)
- Griffin Road (5)
- Harbord Road (73)
- Harold Place (7)
- Hawkesbury Avenue (175)
- Headland Road (7)
- Henry Street (15)
- Heron Place (14)
- High Street (19)
- Hogarth Avenue (15)
- Holborn Avenue (153)
- Howard Avenue (1,026)
- Ilikai Place (109)
- Kalora Avenue (33)
- Karrabee Street (7)
- Kempsey Close (59)
- Kenibea Place (7)
- Keswick Street (18)
- Kingsway (307)
- Lewis Street (90)
- Lismore Avenue (355)
- Little Street (6)
- Lookout Avenue (11)
- Lynwood Avenue (90)
- Maranui Avenue (29)
- May Road (48)
- Mcintosh Road (62)
- Monash Parade (127)
- Mooramba Road (648)
- Moorilla Street (56)
- Oaks Avenue (1,087)
- Oceana Street (16)
- Olympic Highway (1)
- Ozone Parade (21)
- Pacific Parade (2,019)
- Painters Parade (13)
- Palara Place (14)
- Parkes Road (1)
- Patey Street (19)
- Pipino Place (10)
- Pittwater Road (1,661)
- Prescott Avenue (77)
- Quirk Street (109)
- Redfern Parade (11)
- Redman Road (223)
- Regent Street (115)
- Richmond Avenue (262)
- Selby Avenue (22)
- South Creek Road (211)
- St David Avenue (3)
- Stoddart Place (25)
- Sturdee Parade (726)
- Summit Avenue (16)
- Tango Avenue (67)
- Tarra Crescent (24)
- Tasman Street (44)
- The Crescent (401)
- The Strand (149)
- Tor Road (67)
- Tulich Avenue (23)
- Turner Street (12)
- Undercliffe Street (29)
- Vale Avenue (15)
- Victor Road (116)
- Warringah Road (9)
- Westminster Avenue (319)
- Whaddon Avenue (21)
- Wheeler Parade (287)
- Wigan Road (5)