Burra Creek NSW 2722
73 addresses · 14 streets
Riverina Electorate › Cootamundra-Gundagai Regional LGA › Burra Creek · 313 km from Sydney

Living Here
Burra Creek is a suburb of New South Wales, home to about 71 people, with a median age of 45. The typical household earns around $1,374 a week, with median rent near $120 a week. Most homes are houses. About 61% of households own their home and 24% rent. Most workers drive to work. Common community backgrounds include English, Australian, Ancestry NS. On the ABS socio-economic scale it sits in decile 7 of 10 nationally — a mid-range area.
Over time — Census 2001 → 2021
Dashed line: district figures for the Gundagai statistical area (SA2), the smallest area the ABS published before 2011. Solid line: Burra Creek itself.
Getting Around & Local Services
Socio-economic Standing
Deciles from 1 (lowest) to 10 (highest), against all Australian suburbs. The overall figure weighs advantage and disadvantage together; economic resources counts income and housing, and education & jobs counts qualifications and occupation. They often differ. Source: ABS SEIFA 2021.
Tree cover
🌳 Tree canopy: 13% share of land under canopy · satellite map, 2020
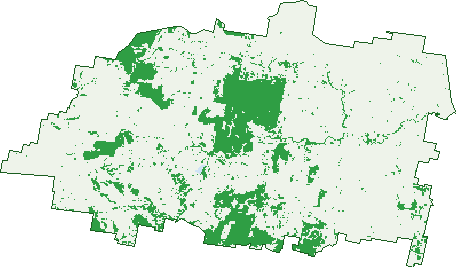
Green: 10 m cells where trees dominate, satellite 2021. Blue: water. The line is the suburb boundary.
| Canopy share, 1 m canopy height map, 2020 | 13.0% |
|---|---|
| Land with trees, 10 m satellite map, 2021 | 18.9% |
Demographics
Population by age in Burra Creek
| 0-4 | 3 |
|---|---|
| 5-14 | 12 |
| 15-19 | 0 |
| 20-24 | 5 |
| 25-34 | 9 |
| 35-44 | 8 |
| 45-54 | 8 |
| 55-64 | 6 |
| 65-74 | 12 |
| 75-84 | 6 |
| 85+ | 0 |
Dwelling types in Burra Creek
| House | 30 |
|---|---|
| Townhouse | 0 |
| Apartment | 0 |
| Other | 0 |
Households by weekly income in Burra Creek
| <$650 | 4 |
|---|---|
| $650-1,499 | 5 |
| $1,500-2,999 | 0 |
| $3,000+ | 0 |
Top ancestries in Burra Creek
| English | 48 |
|---|---|
| Australian | 27 |
| Ancestry NS | 12 |
| Irish | 9 |
| Scottish | 6 |
| German | 5 |
Housing tenure in Burra Creek
| Owned | 17 |
|---|---|
| Mortgage | 6 |
| Rented | 9 |
| Other | 6 |
Cars per household in Burra Creek
| 0 | 0 |
|---|---|
| 1 | 5 |
| 2 | 13 |
| 3 | 10 |
| 4+ | 0 |
Commute to work in Burra Creek
| Car | 18 |
|---|---|
| Train | 0 |
| Bus | 0 |
| Tram/ferry | 0 |
| Walked | 0 |
| Bicycle | 0 |
| Home | 18 |
Birds & Wildlife Nearby
159 bird observations recorded near Burra Creek — most often seen:
- Australian Magpie (12)
- Sulphur-crested Cockatoo (10)
- Willie Wagtail (8)
- Galah (7)
- Laughing Kookaburra (7)
- Superb Fairy-wren (7)
- White-plumed Honeyeater (7)
- Black-faced Cuckoo-shrike (6)
- Pied Currawong (6)
- Striated Pardalote (6)
- Eastern Rosella (5)
- Grey Shrike-thrush (5)
- Magpie-lark (5)
Show all 30 birds recorded near Burra Creek
- Red-rumped Parrot (5)
- Welcome Swallow (5)
- White-winged Chough (5)
- Australian Raven (4)
- Australian Wood Duck (4)
- Common Starling (4)
- Noisy Miner (4)
- Rainbow Bee-eater (4)
- Red Wattlebird (4)
- Rufous Songlark (4)
- Wedge-tailed Eagle (4)
- Weebill (4)
- Yellow-faced Honeyeater (4)
- Yellow-rumped Thornbill (4)
- Brown Treecreeper (3)
- Crested Pigeon (3)
- Flame Robin (3)
Sightings reported by observers, not a survey, so the counts show what people record rather than what lives here. Source: Atlas of Living Australia.
Nearby Suburbs
The closest suburbs to Burra Creek:
- Jones Creek (11.3 km)
- Muttama (12.7 km)
- Reno (13 km)
- Coolac (14.9 km)
- Gundagai (19.2 km)
- Nangus (19.8 km)
- Eurongilly (22.3 km)
- Bethungra (22.4 km)
Embed this suburb
Add this free Burra Creek stat card to your own site — just copy the code:
Preview:
Cite this page
Quoting these figures? Copy the credit line:
Keep an eye on Burra Creek
One email when this data meaningfully changes — new census figures, prices, rankings. No spam, unsubscribe anytime.
Streets
- Armours Road (3)
- Attwood Road (4)
- Bethungra Road (1)
- Brawlin Road (3)
- Burra Road (29)
- Finlays Lane (2)
- Ginendoe Road (1)
- Jerusalem Road (2)
- Lockhart Road (3)
- The Hill Road (1)
- Wambidgee Road (4)
- Wattle Valley Road (2)
- Willis Road (3)
- Yammatree Road (15)